

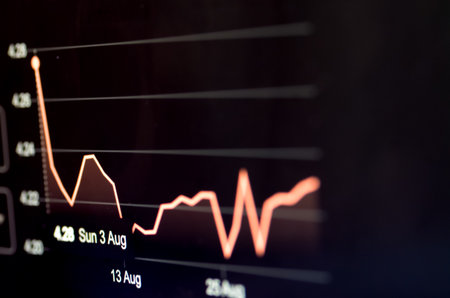
Broker predicting recession in 2020 due to global corona virus pandemic.
Коллекция по умолчанию
Коллекция по умолчанию
Создать новую

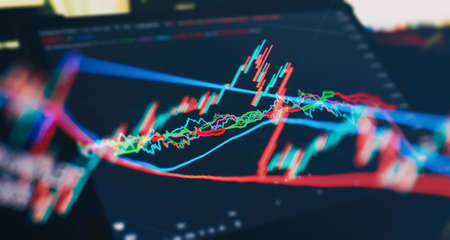
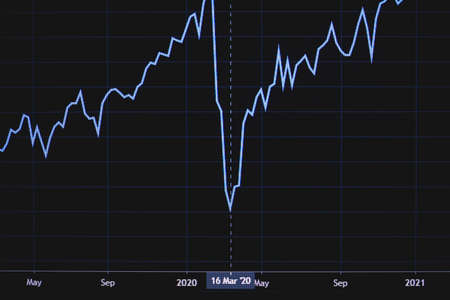
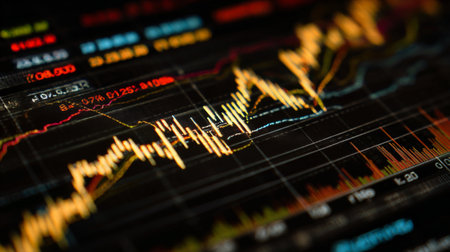
Shallow depth of field (selective focus) with details of a chart showing the stock market crash from March 2020 due to the Covid-19 pandemic on a computer screen (S&P500 index)
Коллекция по умолчанию
Коллекция по умолчанию
Создать новую

Businessman turning virtual knob measurement from low to high level for Business risk management and analysis assessment concept.
Коллекция по умолчанию
Коллекция по умолчанию
Создать новую
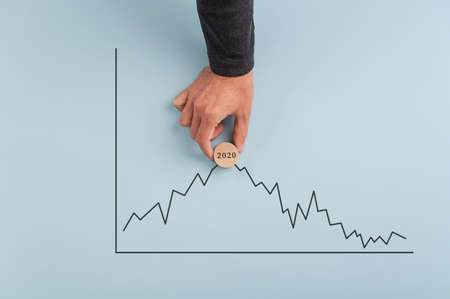
Male hand placing a wooden cut circle with 2020 sign on it on top of a statistical graph just befor a decline, predicting a stock market crisis.
Коллекция по умолчанию
Коллекция по умолчанию
Создать новую
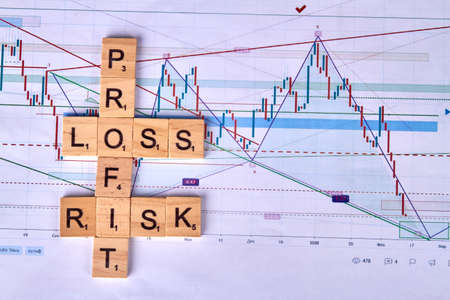
Wooden cubes with profit risk and loss words.
Коллекция по умолчанию
Коллекция по умолчанию
Создать новую
A stock market graph on a black background.
Коллекция по умолчанию
Коллекция по умолчанию
Создать новую
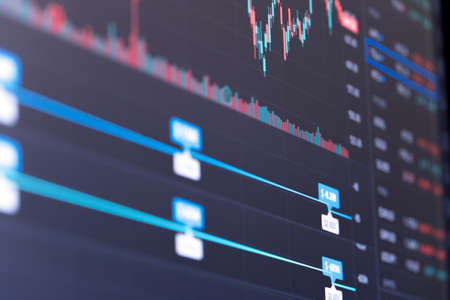
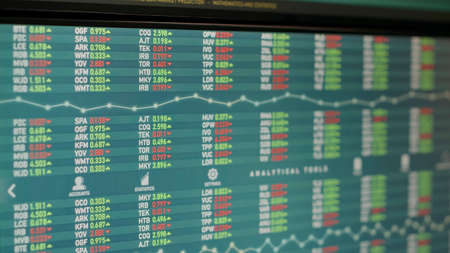
securities price chart on the monitor screen
Коллекция по умолчанию
Коллекция по умолчанию
Создать новую
Grow Stock market trading graph in graphic concept.financial investment or economic trends business design. Abstract finance background.Low angle shot.
Коллекция по умолчанию
Коллекция по умолчанию
Создать новую

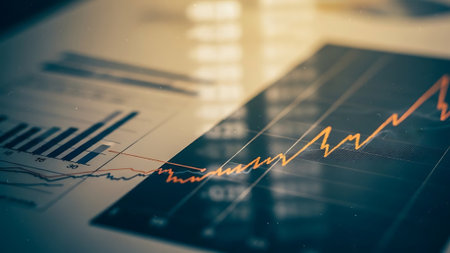
image is a graph of financial development on a computer monitor.
Коллекция по умолчанию
Коллекция по умолчанию
Создать новую
Our profits are on the rise. Shot of paperwork and stationery on a desk in an empty office during the day.
Коллекция по умолчанию
Коллекция по умолчанию
Создать новую
Stock Market Chart on Blue Background. share drop down and stock up
Коллекция по умолчанию
Коллекция по умолчанию
Создать новую

Fraud Risk write on sticky note with keywords isolated on wooden table.
Коллекция по умолчанию
Коллекция по умолчанию
Создать новую

Risk and business management concepts with text on wood box on laptop.copy space
Коллекция по умолчанию
Коллекция по умолчанию
Создать новую
Stock market trading graph in graphic concept.financial investment or economic trends business design. Abstract finance background.Low angle shot.
Коллекция по умолчанию
Коллекция по умолчанию
Создать новую
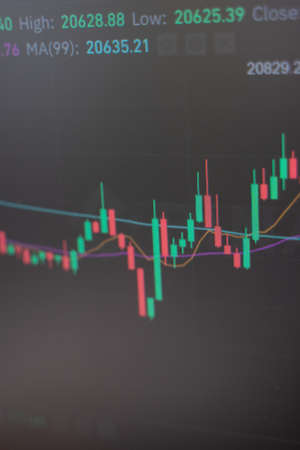
Stock Market Trading Chart Investment Analysis Business Index Chart Finance Board Chart
Коллекция по умолчанию
Коллекция по умолчанию
Создать новую
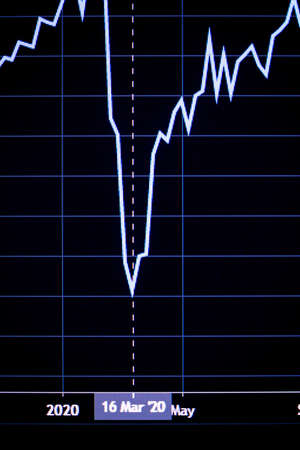
Shallow depth of field (selective focus) with details of a chart showing the stock market crash from March 2020 due to the Covid-19 pandemic on a computer screen (S&P500 index)
Коллекция по умолчанию
Коллекция по умолчанию
Создать новую
Change the stock market chart. The fall in the value of cryptocurrencies. Brokerage data
Коллекция по умолчанию
Коллекция по умолчанию
Создать новую

image of the financial graph on a computer monitor.
Коллекция по умолчанию
Коллекция по умолчанию
Создать новую
Financial graphic chart
Коллекция по умолчанию
Коллекция по умолчанию
Создать новую
Business statistics and Analytics value . Abstract glowing forex chart interface background. Investment, trade, stock, finance and analysis concept.
Коллекция по умолчанию
Коллекция по умолчанию
Создать новую

Stock market graph on screen. Ticker on monitor screen. Investing, Finance and Economic concept. Shallow depth of field.
Коллекция по умолчанию
Коллекция по умолчанию
Создать новую

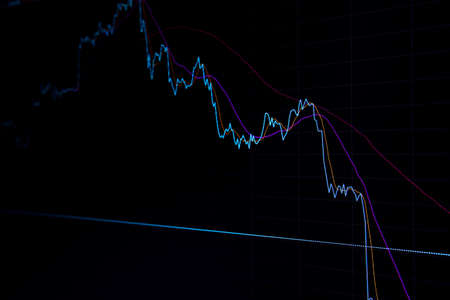
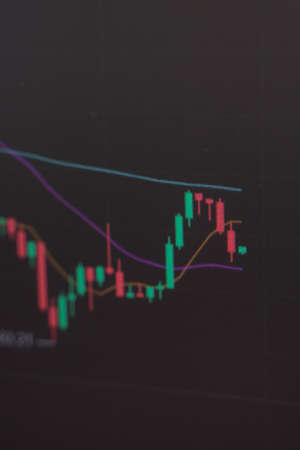
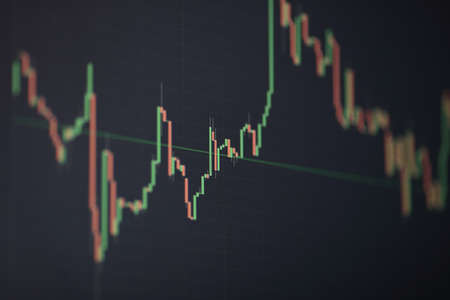
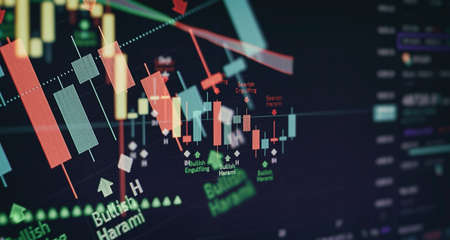
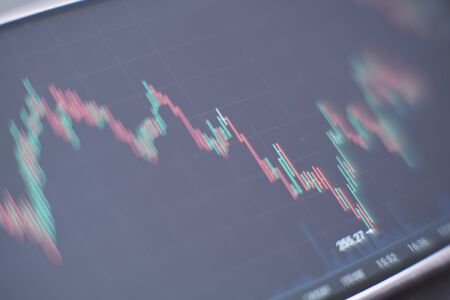
Shallow depth of field (selective focus) with details of a candlestick chart on a computer screen.
Коллекция по умолчанию
Коллекция по умолчанию
Создать новую

Businessman in suit holding of K wood block and removed with the word RISK. The concept of reducing risks and financial risk assessment, risk reward and portfolio risk management concept.
Коллекция по умолчанию
Коллекция по умолчанию
Создать новую
Stock or business market analysis concept. Business financial or stock market background.
Коллекция по умолчанию
Коллекция по умолчанию
Создать новую
Medium shot of a closeup on charts and graphs illustrating loan interest rate fluctuations over time
Коллекция по умолчанию
Коллекция по умолчанию
Создать новую
Tablet Index, Exchange Trading Forex Finance Graphic Concept
Коллекция по умолчанию
Коллекция по умолчанию
Создать новую
Financial stock market graph. Stock Exchange. Selective focus.
Коллекция по умолчанию
Коллекция по умолчанию
Создать новую
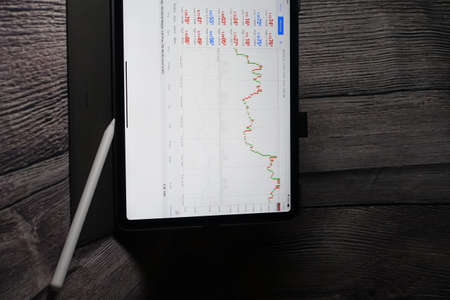
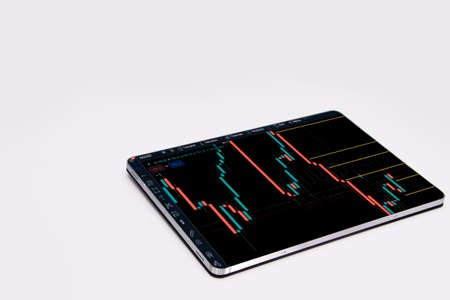
Trading forex with METATRADER 4 on Apple iPad Pro 11 inch. iPad Pro is the most user friendly which good for people on the go.
Коллекция по умолчанию
Коллекция по умолчанию
Создать новую

Shallow depth of field (selective focus) with details of a candlestick chart on a computer screen.
Коллекция по умолчанию
Коллекция по умолчанию
Создать новую
Shallow depth of field (selective focus) with details of a chart showing the stock market crash from March 2020 due to the Covid-19 pandemic on a computer screen (S&P500 index)
Коллекция по умолчанию
Коллекция по умолчанию
Создать новую
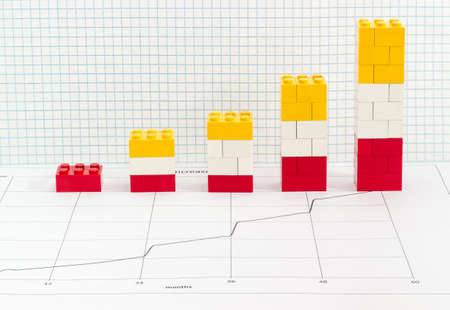
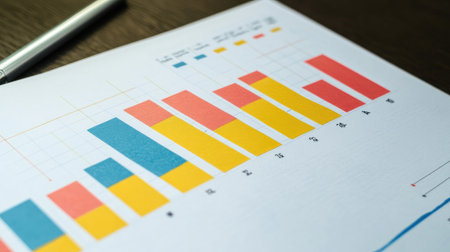
Stacked bar chart with bars which are made from colored plastic parts children's designer on the sheet with line chart against background of squared paper
Коллекция по умолчанию
Коллекция по умолчанию
Создать новую

Businessperson Holding Red Increasing Arrow Behind The Risk Word Text On Table
Коллекция по умолчанию
Коллекция по умолчанию
Создать новую
Business Objects in the office on the table.
Коллекция по умолчанию
Коллекция по умолчанию
Создать новую
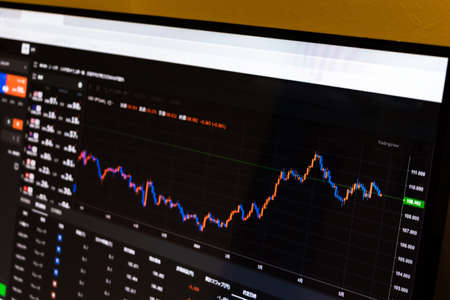
Stockmarket diagram and grah on displayscreen
Коллекция по умолчанию
Коллекция по умолчанию
Создать новую
Charts Graphs paper. Financial development, Banking Account, Statistics, Investment Analytic research data economy, Stock exchange Business office company meeting concept.
Коллекция по умолчанию
Коллекция по умолчанию
Создать новую
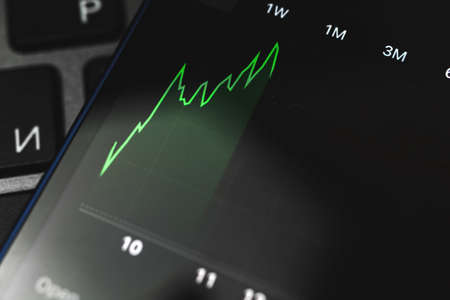
A detailed line graph shows financial trends marked by an upward movement, reflecting analysis of data for improved decision-making processes.
Коллекция по умолчанию
Коллекция по умолчанию
Создать новую
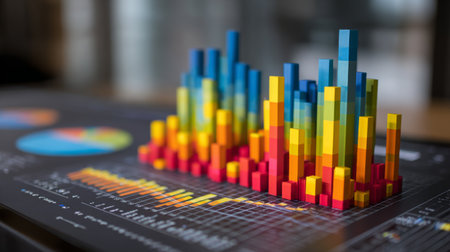
Vibrant 3D bar chart sits on a digital workspace, showcasing data analysis. The image represents growth, trends, and technology in modern business presentations.
Коллекция по умолчанию
Коллекция по умолчанию
Создать новую
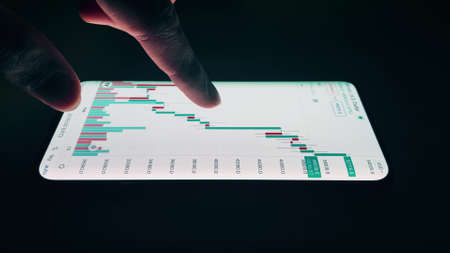
A trader investor analyzes candlestick charts of stocks, crypto currencies in a smartphone application. Trading, investing and technical analysis concept. Close-up of a smartphone screen. 4k
Коллекция по умолчанию
Коллекция по умолчанию
Создать новую

Stock market data graph on monitor. Finance and investment concept. 3d rendering
Коллекция по умолчанию
Коллекция по умолчанию
Создать новую
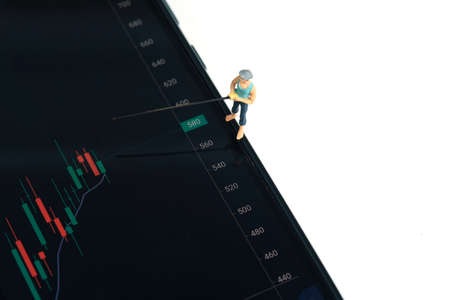
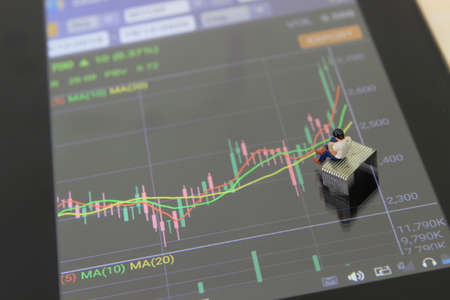
Miniature people toy photography. An angler standing searching investment profit, opened candle chart from stock market app. Isolated on white background.
Коллекция по умолчанию
Коллекция по умолчанию
Создать новую

Analysis of data from graphs. select focus.
Коллекция по умолчанию
Коллекция по умолчанию
Создать новую
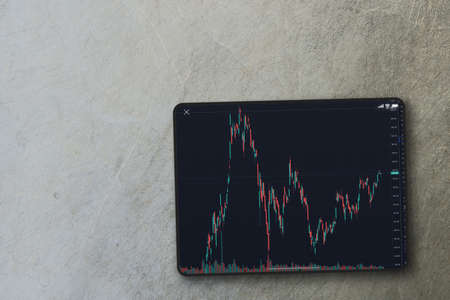
Financial stock market graph on the tablet screen on cement background. Top view. Stock Exchange.
Коллекция по умолчанию
Коллекция по умолчанию
Создать новую
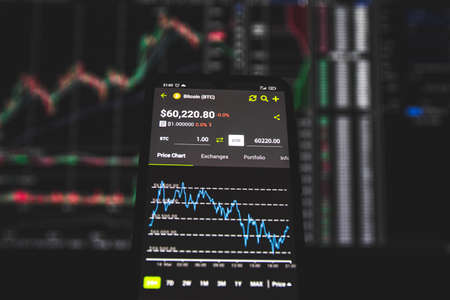
Cryptocurrency exchange chart. Bitcoin price goes up to 60 000 dollars. Blockchain and digital money
Коллекция по умолчанию
Коллекция по умолчанию
Создать новую
Stock Market Loss Trading Chart Investment Analysis Business Index Chart Finance Board Chart
Коллекция по умолчанию
Коллекция по умолчанию
Создать новую
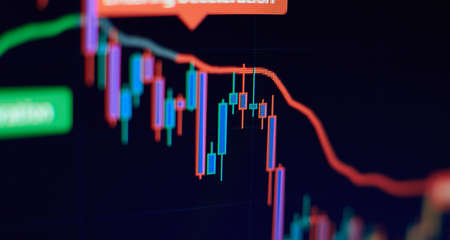
Data financial instruments chart, downtrend stock market analysis report
Коллекция по умолчанию
Коллекция по умолчанию
Создать новую
Graphic detail stock exchange market indicators
Коллекция по умолчанию
Коллекция по умолчанию
Создать новую
Bitcoin. Change the price on the display. Brokerage information, display of the price of the electronic means of payment
Коллекция по умолчанию
Коллекция по умолчанию
Создать новую
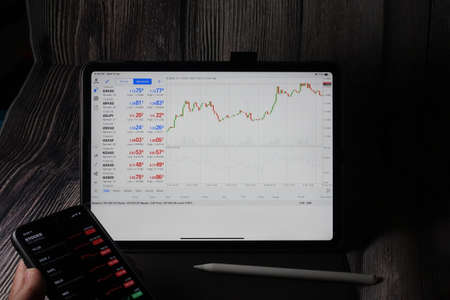
Trading forex with METATRADER 4 on Apple iPad Pro 11 inch. iPad Pro is the most user friendly which good for people on the go.
Коллекция по умолчанию
Коллекция по умолчанию
Создать новую
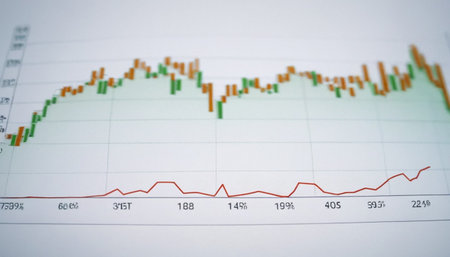
financial chart on the white background with soft focus and shallow depth of field
Коллекция по умолчанию
Коллекция по умолчанию
Создать новую
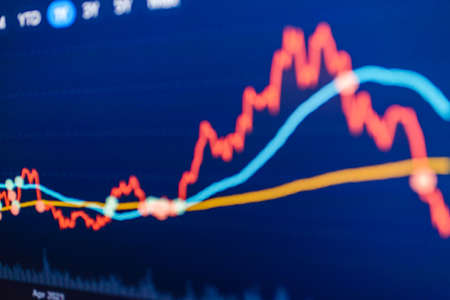
Close-up of a financial graph on a computer screen, showcasing upward and downward trends with detailed line and bar charts.
Коллекция по умолчанию
Коллекция по умолчанию
Создать новую

A colorful D bar graph showcasing quarterly sales data, with bars labeled in different colors, placed on a sleek black surface, creating a striking visual presentation.
Коллекция по умолчанию
Коллекция по умолчанию
Создать новую
Business workplace with keyboard mouse and papers with graphs and diagrams
Коллекция по умолчанию
Коллекция по умолчанию
Создать новую
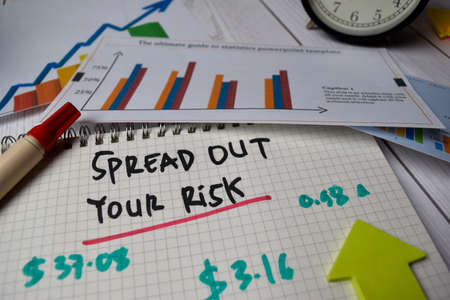
Spread Out Your Risk write on a book isolated on Office Desk. Stock market concept
Коллекция по умолчанию
Коллекция по умолчанию
Создать новую
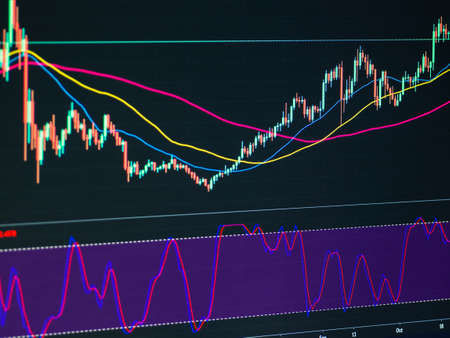
Financial chart with trading data and technical analysis tools, Stock Market, investment, trading
Коллекция по умолчанию
Коллекция по умолчанию
Создать новую
Documents with colourful charts, graphs and diagrams
Коллекция по умолчанию
Коллекция по умолчанию
Создать новую
Stock market or forex trading graph and candlestick chart suitable for financial investment concept. Abstract finance background.
Коллекция по умолчанию
Коллекция по умолчанию
Создать новую
Economic graph with diagrams on the stock market, for business and financial concepts and reports.Abstract blue background.
Коллекция по умолчанию
Коллекция по умолчанию
Создать новую

Business success and growth concept.Stock market business graph chart on digital screen. Stock trading, crypto currency background.
Коллекция по умолчанию
Коллекция по умолчанию
Создать новую
Digital Finance: Analyzing Volatile Market Graphs and Managing Tiered Compensation Schedules on a Desktop.
Коллекция по умолчанию
Коллекция по умолчанию
Создать новую
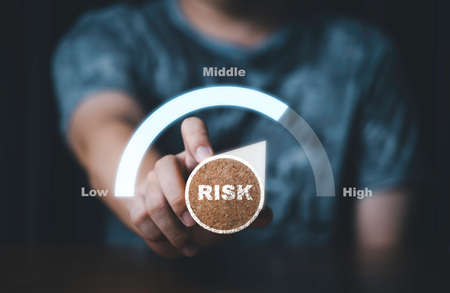
Hand holding and turning risk know from low to middle and high level meter scale from risk management analysis of business and investment concept.
Коллекция по умолчанию
Коллекция по умолчанию
Создать новую
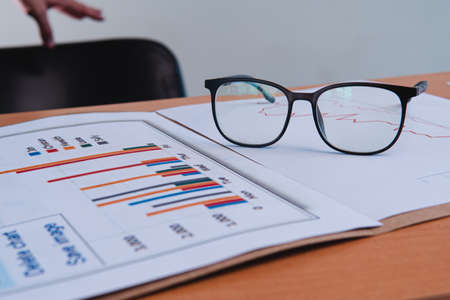
Work table of a businessman with papers, graphs and glasses. Business presentation template with papers, folder and a chair in the background. High quality photo
Коллекция по умолчанию
Коллекция по умолчанию
Создать новую

A vibrant and creative illustration of hand-drawn graphs and arrows on a notebook, showcasing financial analysis and business growth concepts in a warm workspace.
Коллекция по умолчанию
Коллекция по умолчанию
Создать новую
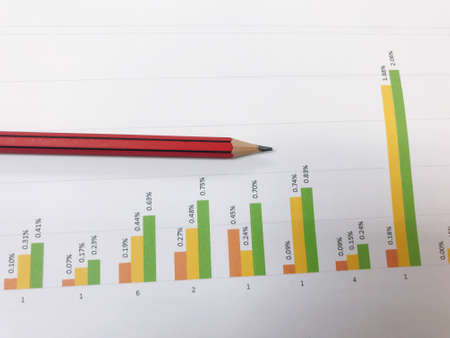
graph paper showing business information, Business graph analysis concept
Коллекция по умолчанию
Коллекция по умолчанию
Создать новую
Business and trading finance contept. Stock exchange market chart view on smart phone screen.
Коллекция по умолчанию
Коллекция по умолчанию
Создать новую

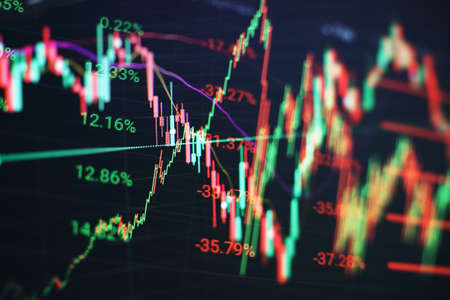
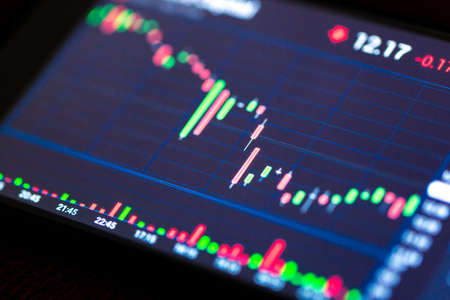
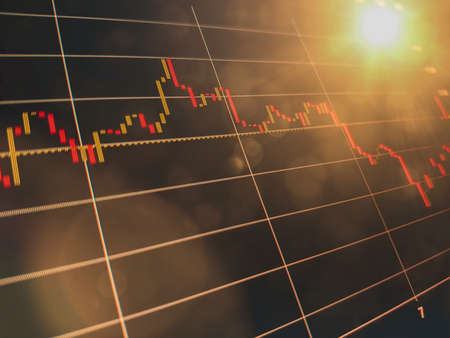
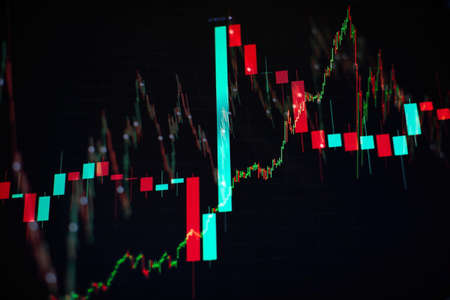
graph and indicator, red and green candlestick chart on blue theme screen, market volatility, up and down trend. Stock trading, cryptocurrencies background.
Коллекция по умолчанию
Коллекция по умолчанию
Создать новую
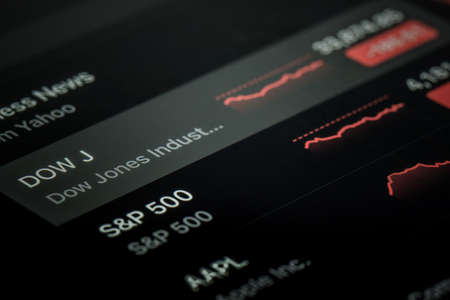
stock market tracking and stocks
Коллекция по умолчанию
Коллекция по умолчанию
Создать новую
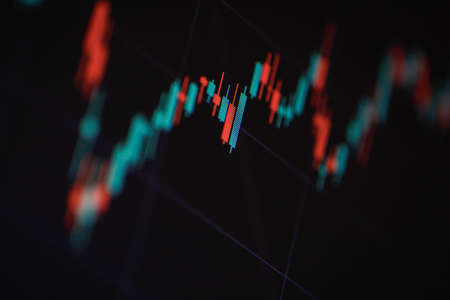
Shallow depth of field (selective focus) with details of a candlestick chart on a computer screen.
Коллекция по умолчанию
Коллекция по умолчанию
Создать новую
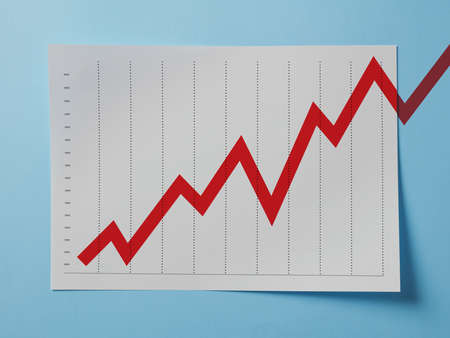
Growing chart on A4 page on blue background
Коллекция по умолчанию
Коллекция по умолчанию
Создать новую
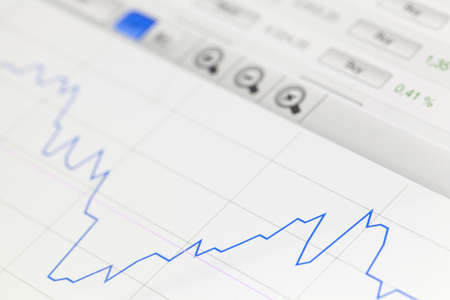
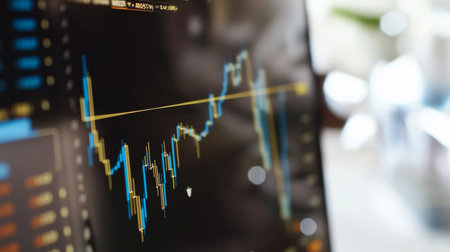
Forex chart displayed on the monitor
Коллекция по умолчанию
Коллекция по умолчанию
Создать новую
Simple Conceptual Photo, illustration for Gambler Investor Mini Figure Toy businessman Sadly watching Graphic Candle Light Stick, Sitting at Big Plastic Dice
Коллекция по умолчанию
Коллекция по умолчанию
Создать новую
The business plan at the meeting and analyze financial numbers to view the performance of the company.
Коллекция по умолчанию
Коллекция по умолчанию
Создать новую
Notebook showing creative mind maps, charts, and highlighted study material for visual learners
Коллекция по умолчанию
Коллекция по умолчанию
Создать новую
graph with diagrams on the stock market, for business and financial concepts and reports.Abstract blue background.
Коллекция по умолчанию
Коллекция по умолчанию
Создать новую
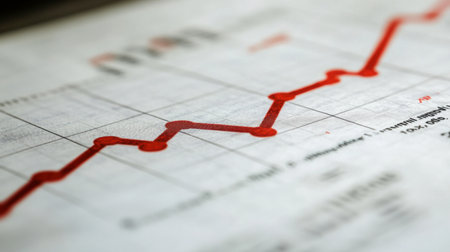
Close-up of a business chart showing a rising trend line, symbolizing growth and progress in financial performance. Ideal for economic insights.
Коллекция по умолчанию
Коллекция по умолчанию
Создать новую
Business graph. Bullish Bearish trend. Candlestick chart uptrend downtrend . Stock trade on online market forex.
Коллекция по умолчанию
Коллекция по умолчанию
Создать новую
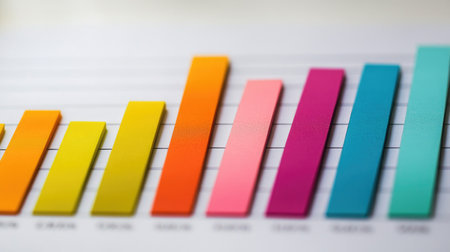
A colorful bar chart representing stock performance over time, with various heights and vibrant colors, set against a clean, professional backdrop.
Коллекция по умолчанию
Коллекция по умолчанию
Создать новую
Abstract finance curve blue background Investment, marketing concept.Blurred background.
Коллекция по умолчанию
Коллекция по умолчанию
Создать новую

Stockmarket online trading chart candlestick on crypto currency platform. Stock exchange financial market price candles graph data pattern analysis concept. Computer screen closeup background
Коллекция по умолчанию
Коллекция по умолчанию
Создать новую

A close-up of colorful wooden blocks arranged on a vibrant abstract background. This image captures creativity, playfulness, and artistic design, ideal for educational materials or decor.
Коллекция по умолчанию
Коллекция по умолчанию
Создать новую
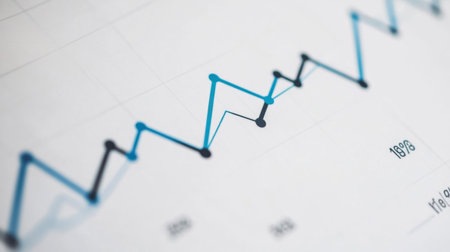
A close-up view of a blue and black line graph on a white background, showcasing trends and data analysis essential for business reporting and decision-making.
Коллекция по умолчанию
Коллекция по умолчанию
Создать новую

A statistical report with a diagram lies on the table
Коллекция по умолчанию
Коллекция по умолчанию
Создать новую
Histograms
Коллекция по умолчанию
Коллекция по умолчанию
Создать новую
Technical price graph and indicator, red and green candlestick chart on blue theme screen, market volatility, up and down trend. Stock trading, crypto currency background.
Коллекция по умолчанию
Коллекция по умолчанию
Создать новую
A close-up of a stock market trading screen displaying fluctuating graphs and charts of various stocks.
Коллекция по умолчанию
Коллекция по умолчанию
Создать новую
Business performance analysis. Business Graphs with Keyboard, pen.
Коллекция по умолчанию
Коллекция по умолчанию
Создать новую
Indicator, red and green candlestick chart on blue theme screen, market volatility, up and down trend. Stock trading, crypto currency background.
Коллекция по умолчанию
Коллекция по умолчанию
Создать новую
Financial chart with uptrend line close-up, stock market on the screen, business background photo
Коллекция по умолчанию
Коллекция по умолчанию
Создать новую
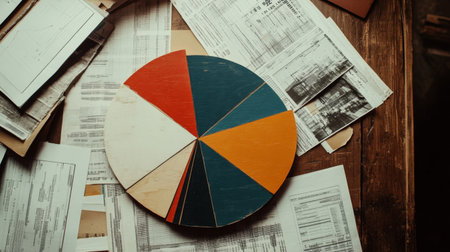
A colorful chart rests on a wooden table surrounded by various documents, showcasing a creative workspace with artistic and analytical elements.
Коллекция по умолчанию
Коллекция по умолчанию
Создать новую
A close-up financial chart with an uptrend line candle chart on the stock or cryptocurrency market on a black monitor background. Investment chart of the stock or cryptocurrency market with indicators
Коллекция по умолчанию
Коллекция по умолчанию
Создать новую
This image showcases an abstract view of financial data with colorful graphs and lines on a black background, highlighting various trends in stock market performance analysis.
Коллекция по умолчанию
Коллекция по умолчанию
Создать новую
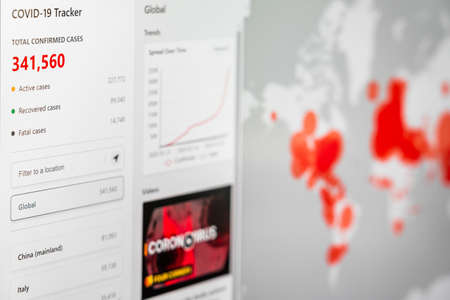
BUCHAREST, ROMANIA - MARCH 23, 2020: Coronavirus Total Cases Of The Pandemic Spreading All Around The Globe In March
Коллекция по умолчанию
Коллекция по умолчанию
Создать новую
Stock or business market analysis concept. Business financial or stock market background.
Коллекция по умолчанию
Коллекция по умолчанию
Создать новую
An office worker shows his colleagues a presentation with a company development graph at night on the company's computer
Коллекция по умолчанию
Коллекция по умолчанию
Создать новую
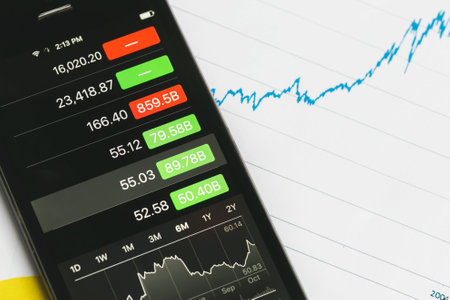
Real time stock sales statistics with global hedge fund on monitor, trade exchange numbers changing after buying and selling money. Financial investment with profit. Close up. Tripod shot.
Коллекция по умолчанию
Коллекция по умолчанию
Создать новую
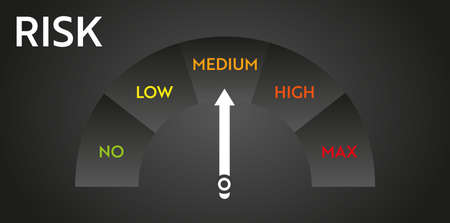
Risk level meter indicator. Stress speedometer. Chat control concept presentation
Коллекция по умолчанию
Коллекция по умолчанию
Создать новую
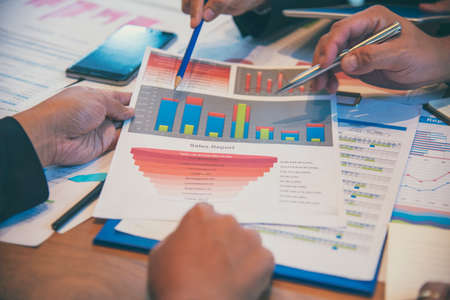
Group of business people meeting in conference room brainstorming consult business document graph chart office desk. Diversity multiethnic group of business people brainstorming and working together.
Коллекция по умолчанию
Коллекция по умолчанию
Создать новую
Female hand with smartphone trading stock online. Business concept
Коллекция по умолчанию
Коллекция по умолчанию
Создать новую

Image of financial data processing over cityscape. global finance, business and digital interface concept digitally generated image.
Коллекция по умолчанию
Коллекция по умолчанию
Создать новую

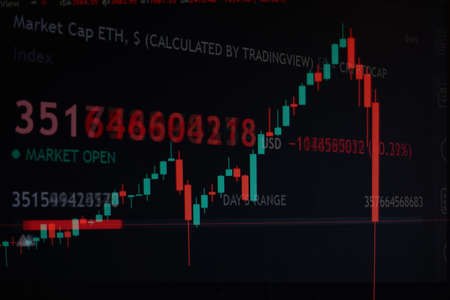
The market volatility of crypto trading with total sell prices of market cap numbers, for analysis up and downtrend. Stock trading, crypto currency background concept.
Коллекция по умолчанию
Коллекция по умолчанию
Создать новую
Detailed view of a stock market graph exhibiting a rising trend, showcasing financial data and analysis tools for effective trading and investment decisions.
Коллекция по умолчанию
Коллекция по умолчанию
Создать новую
Legion-Media
Создайте свои проекты на основе качественных стоковых фотографий и видео.


Copyright © Legion-Media.